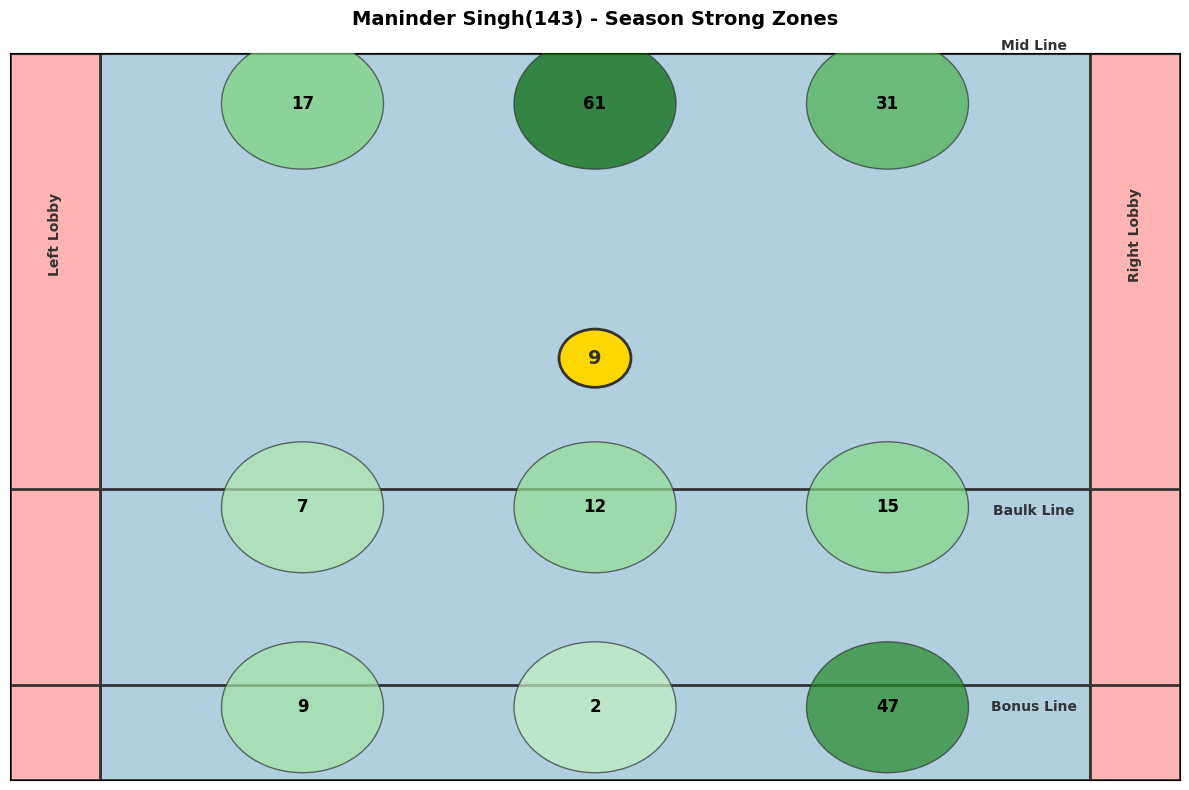
plot_player_zones(player_id, season, zone_type='strong')
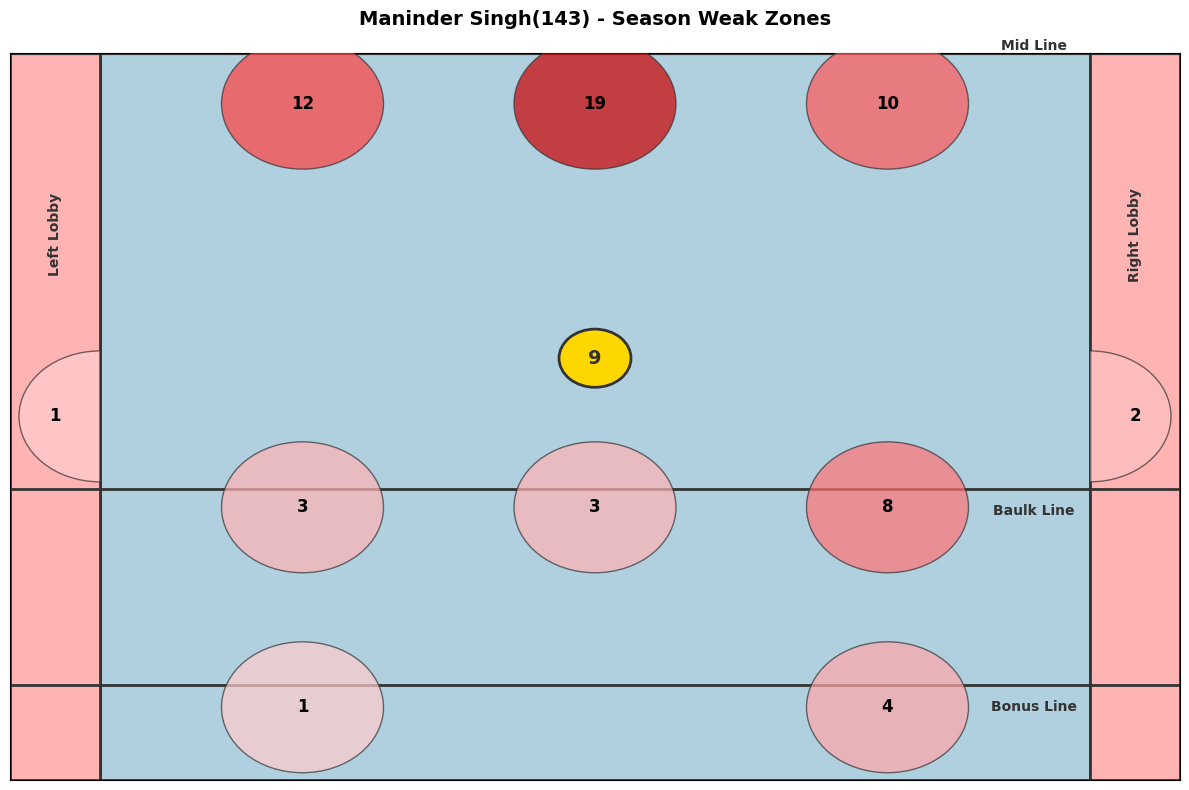
Visualize a player’s strong or weak zones on the kabaddi court for a specific season.
Parameters:
player_id(int): The unique identifier for the player.season(int): The season number for which the data will be retrieved.zone_type(str): Type of zones to plot, either'strong'or'weak'.
Example Usage:
pkl.plot_player_zones(player_id=143, season=5, zone_type='strong')
pkl.plot_player_zones(player_id=143, season=5, zone_type='weak')
Notes:
- The function plots a heatmap of a player’s strong or weak zones during a season on the kabaddi court.
- Each zone’s intensity reflects the player’s performance in that zone.
- Raises ValueError if the season is invalid or no data is found for the specified player.