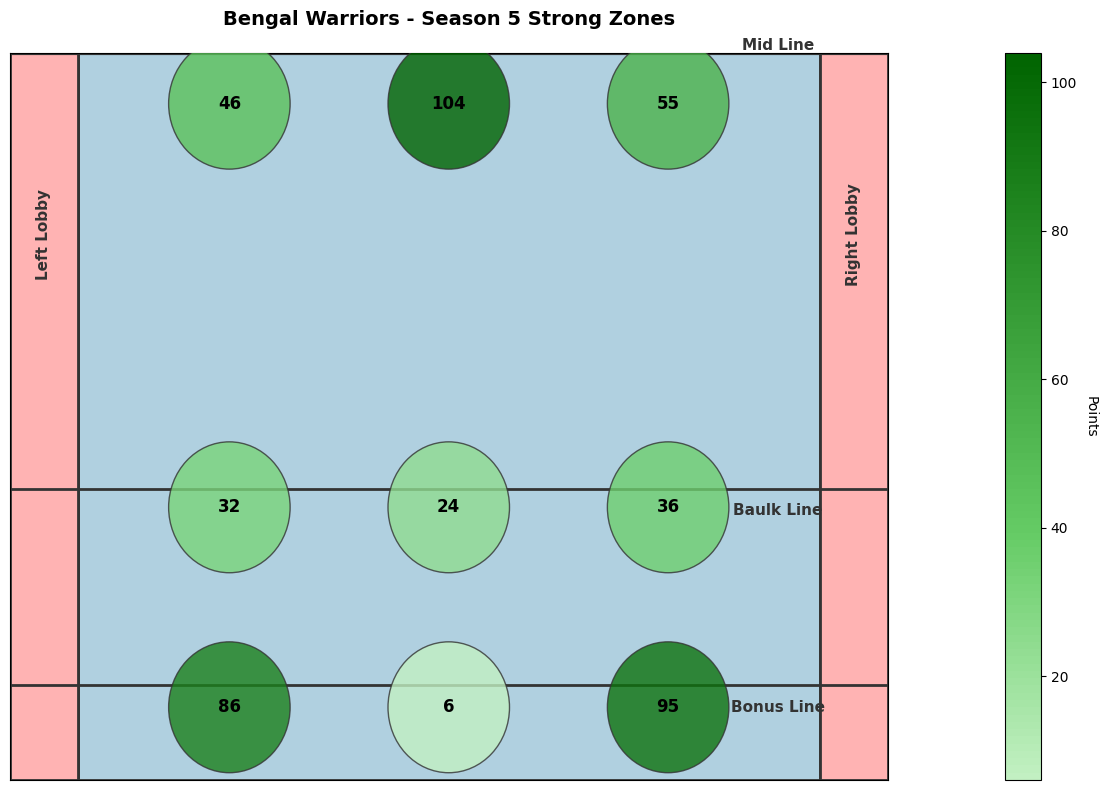
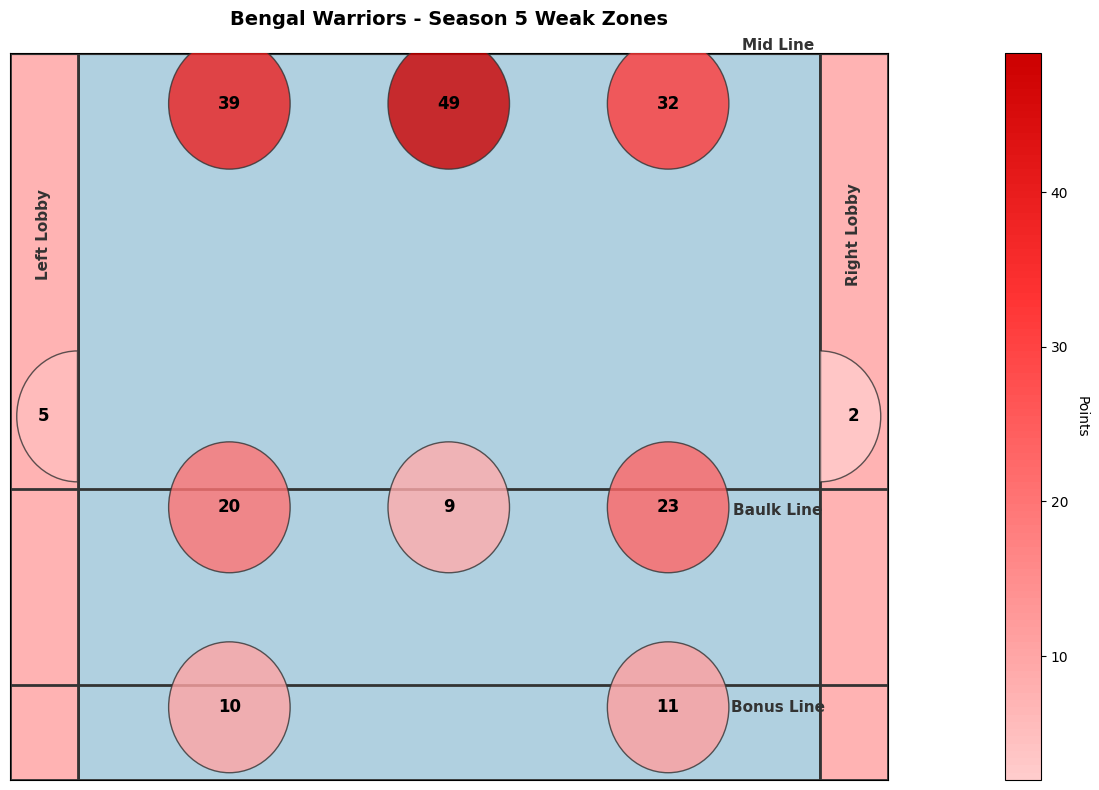
plot_team_zones(team_id, season, zone_type='strong')
Visualize a team’s strong or weak zones on the kabaddi court for a specific season.
Parameters:
team_id(int): The unique identifier for the team.season(int): The season number for which the data will be retrieved.zone_type(str): Type of zones to plot, either'strong'or'weak'.
Example Usage:
pkl.plot_team_zones(team_id=4, season=5, zone_type='strong')
pkl.plot_team_zones(team_id=4, season=5, zone_type='weak')
Notes:
- The function creates a heatmap that visualizes the team’s zone performance across the court.
- Custom color maps are used to highlight strong and weak zone intensities.
- A color bar indicating points is included for easier interpretation.