plot_player_zones_grid(player_ids, season, zone_type='strong', max_cols=4)
Plot a grid of player zone heatmaps for multiple players in a specific season.
Parameters:
player_ids(list of int): List of player IDs for which the zones will be plotted.season(int): The season number for which the data will be retrieved.zone_type(str): Type of zones to plot, either'strong'or'weak'.max_cols(int, optional): Maximum number of columns for the grid layout. Defaults to 4.
Example Usage:
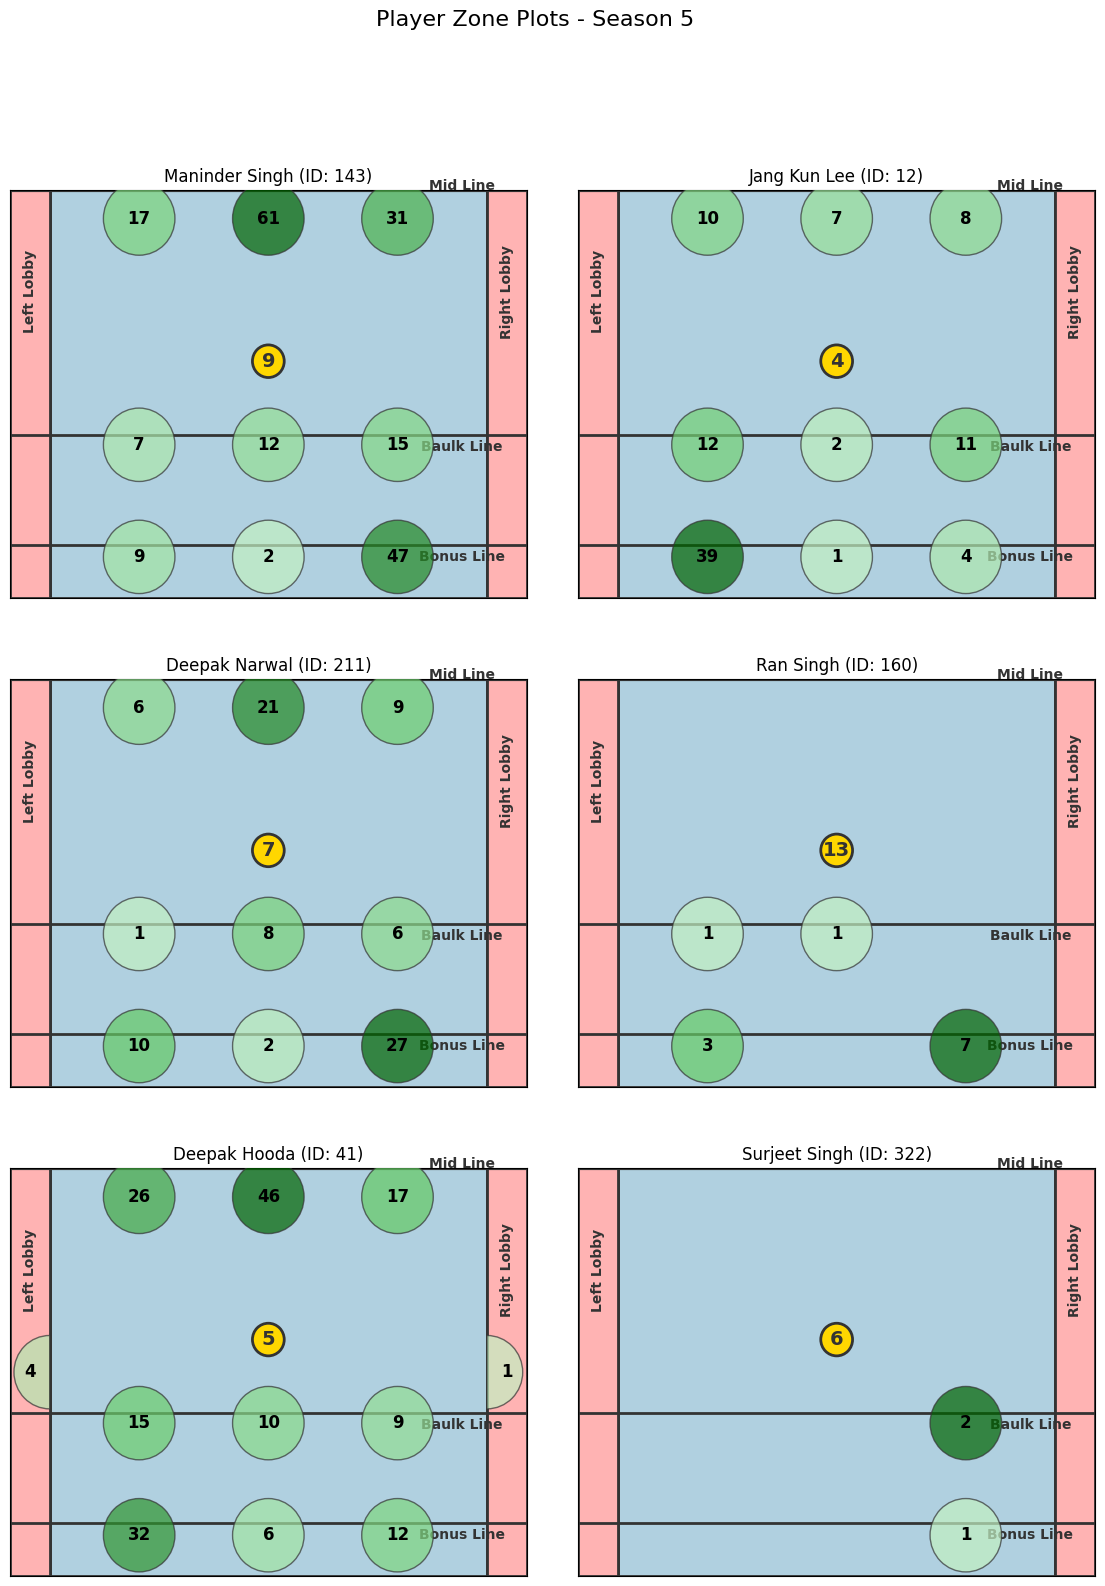
pkl.plot_player_zones_grid([143, 12, 211, 160, 41, 322], season=5, zone_type='strong', max_cols=2)```
Notes:
- This function generates a grid of player zone heatmaps, allowing for side-by-side comparisons of multiple players.
- Invalid player IDs or missing data will be skipped, and only valid plots will be displayed.
- The grid size adjusts based on the number of players and the max_cols setting.